How the Iran-Israel War Is Hammering Dow Jones Futures: The Oil-Stock Market Connection Explained
From Strait of Hormuz closures to $112 oil and 1,000-point Dow crashes, here’s what every American investor needs to understand about the worst oil supply crisis in modern history.
A War That Wall Street Can No Longer Ignore
When the United States and Israel launched coordinated airstrikes against Iran on February 28, 2026 — in an operation the Pentagon codenamed “Operation Epic Fury” — most Wall Street strategists initially shrugged. History, after all, suggested they should. Markets tend to absorb geopolitical shocks quickly. Within 24 hours, however, it became clear this was not a typical Middle East flare-up. This was a war that struck at the very arteries through which the global economy breathes: oil.
Three weeks in, the financial damage is staggering. Dow Jones futures have crashed as much as 1,011 points in a single session. Brent crude oil has surged past $112 a barrel. The Russell 2000 has entered correction territory — down more than 10% from its recent high. And the International Energy Agency has called the situation “the greatest global energy security challenge in history.”
For American investors — whether you own a 401(k), hold individual stocks, or simply fill up at the pump — understanding the precise mechanism by which Middle East conflict translates into market pain is no longer academic. It is urgently practical.
What Actually Happened: From Airstrikes to Market Chaos
The conflict began on February 28, when joint U.S.-Israeli strikes targeted Iranian leadership, military infrastructure, and nuclear facilities. Iran’s Supreme Leader, Ayatollah Ali Khamenei, was killed in the strikes. Iran retaliated swiftly — launching waves of missiles and drones at Israel, U.S. military installations in the Gulf, and critically, at the energy infrastructure of neighboring Gulf states.
The Oil-Stock Market Connection: How It Works
The relationship between oil prices and equity markets is one of the most consequential — and frequently misunderstood — dynamics in all of finance. Here is the chain of causation that has been playing out in real time over the past three weeks.
The Transmission Chain: From War to Your Portfolio
Step 1: The Strait of Hormuz — The World’s Jugular Vein
The Strait of Hormuz is a narrow waterway between Iran and Oman. About 20% of the world’s oil and liquefied natural gas passes through it daily. When the conflict began, vessel traffic through the strait came to a near-halt. Tankers were attacked. Shipping companies rerouted. Iraq declared force majeure on all foreign-operated oilfields. The result was an immediate, severe supply shock to global energy markets.
Rebecca Babin, an energy trader at CIBC Private Wealth, captured the shift in trader psychology perfectly: markets went from “traders with ice in their veins to traders with panic in their veins.” By the second week of March, oil output across Kuwait, Iraq, Saudi Arabia, and the UAE had collectively dropped by a reported 10 million barrels per day — the largest supply disruption in the history of the global oil market.
Step 2: Rising Oil Prices Inflate Business Costs Everywhere
Oil is not just what you pump into your car. It is embedded in the cost structure of virtually every industry. Airlines burn it as jet fuel. Manufacturers use petrochemicals as raw materials. Trucking, shipping, and logistics companies run on diesel. Farmers depend on it for fertilizers and machinery. When oil prices double, these input costs ripple through income statements across the entire economy — squeezing profit margins from airlines to agricultural companies to consumer goods manufacturers.
California gasoline prices surged above $5 per gallon by the second week of March 2026. Airline ticket costs on multiple routes have spiked dramatically. Shipping surcharges are being passed onto consumer prices. The Fed, which had been expected to cut rates, is now holding steady — or may even raise — as inflation expectations climb above 3% in the U.S.
Step 3: Inflation Expectations Derail the Fed
Here is where the oil-stock connection gets especially painful for equity investors. When oil prices surge, inflation expectations rise. Economists at major institutions are now forecasting U.S. inflation peaking above 3% year-on-year in 2026 as a direct result of this conflict. The Federal Reserve, which had been on a path toward rate normalization, finds itself boxed in. Uncertainty about oil prices and the war’s duration could lead the Fed to hold interest rates higher for longer — a scenario that compresses stock valuations, especially for growth and technology equities.
The 10-year Treasury yield spiked 6.6 basis points to 4.198% in early trading on March 8, as markets priced in hotter inflation. Higher yields mean higher discount rates, which reduce the present value of future corporate earnings — a direct headwind for stock prices.
Winners, Losers, and the Sector-by-Sector Breakdown
Not all sectors suffer equally when oil spikes. The war has created dramatic divergences across industries — creating both carnage and opportunity for investors who understand the dynamics.
| Index / Asset | Pre-War Level | Recent Level | Change |
|---|---|---|---|
| Dow Jones Industrial Avg. | 49,000 | 45,577 | ▼ -7% |
| S&P 500 | 6,900 | 6,506 | ▼ -5.7% |
| Nasdaq Composite | 22,800 | 21,647 | ▼ -5% |
| Russell 2000 | — | — | ▼ -10%+ (Correction) |
| Brent Crude Oil | $73/bbl | $112.19/bbl | ▲ +54% |
| WTI Crude Oil | $70/bbl | $98.32/bbl | ▲ +40% |
| Gold | $2,800/oz | $5,029/oz | ▲ Surging |
| US Dollar Index | — | — | ▲ +1.5% (week) |
Energy Majors
Exxon, Chevron surged pre-market. High oil = high profits for integrated oil companies. Defense stocks like Northrop Grumman (+6%), RTX (+4.7%), and Lockheed Martin (+3.4%) also rallied sharply.
Gold & Safe Havens
Gold climbed to $5,029/oz as investors sought safety. The U.S. dollar strengthened against the euro and yen. U.S. Treasuries saw initial demand before yields reversed higher.
Airlines & Travel
American Airlines, Delta, and United sank 2–5% on high fuel costs. Air France fell 9.4%. Lufthansa dropped 5.2%. Tourism to the eastern Mediterranean collapsed. Travel bookings cratered.
Industrials & Small Caps
Boeing and Caterpillar each fell 3.5%+, dragging the Dow disproportionately. The Russell 2000 — filled with domestic, economically-sensitive small caps — entered official correction territory.
How Should American Investors Think About This?
At DailyFinancial, we believe in grounding panic in historical context — and then in honest assessment of what is genuinely different this time.
Strategists at Carson Group reviewed 40 major geopolitical events over 85 years — from Germany’s invasion of France to the Iran-Israel exchange of April 2024. On average, the S&P 500 lost just 0.9% in the first month after such events, then rose 3.4% over the following six months. History says: buy the dip and wait for resolution.
“Historically, what in the near term seems like a geopolitical crisis tends to be largely resolved from a market perspective over the ensuing six months.”
Ryan Detrick, Chief Market Strategist, Carson GroupBut here is where honest analysis demands nuance. This conflict is different from most historical analogues in three critical respects:
1. Scale of the supply disruption is unprecedented. The 10 million barrels-per-day output collapse reported by mid-March is the largest in oil market history — dwarfing even the 1973 Arab oil embargo. The head of the IEA called it “the greatest global energy security challenge in history.” These are not routine hyperbole; the numbers support the claim.
2. The Strait of Hormuz remains effectively closed. This nightmare scenario — feared for decades but never fully realized — has now materialized. Every day the strait remains impassable, pressure on global supply compounds. Unlike a brief airstrike, a months-long closure of shipping lanes cannot be shrugged off.
3. The conflict has a realistic escalation path. Russia has been feeding intelligence to Iran. Gulf states have warned Tehran that further attacks could trigger direct response. Multiple worst-case scenarios — including Iranian nuclear materials falling into dangerous hands — are being actively discussed at the Pentagon.
The base case for markets remains: a relatively contained conflict that ends in weeks, allowing oil to normalize. But the tail risks — a prolonged war, further infrastructure attacks, broader regional expansion — are large enough that prudent investors should not dismiss them as noise.
With inflation expectations rising and oil above $100/bbl, the Federal Reserve is unlikely to cut rates in 2026. The International Monetary Fund has warned that a prolonged conflict poses significant inflationary risk to the global economy. For bond investors, this means continued pressure on prices. For equity investors, especially in rate-sensitive sectors like real estate and utilities, the calculus has shifted meaningfully for the worse.
The Four Metrics That Will Determine Where Markets Go Next
For investors trying to navigate this environment, the following indicators are the most critical signals to track in the weeks ahead.
1. Strait of Hormuz Shipping Traffic. This is the single most important variable. If commercial vessels resume normal passage through the strait, oil prices will fall rapidly and equity markets will stabilize. Any news of reopening, ceasefire, or safe-passage agreements should be treated as the most significant positive catalyst available.
2. Brent Crude at $120 — The Psychological and Economic Threshold. Analysts have consistently warned that sustained oil above $120/bbl would trigger global recession fears. Brent briefly approached $120 in early March before retreating. If it breaks and holds above that level, expect another leg lower in equities.
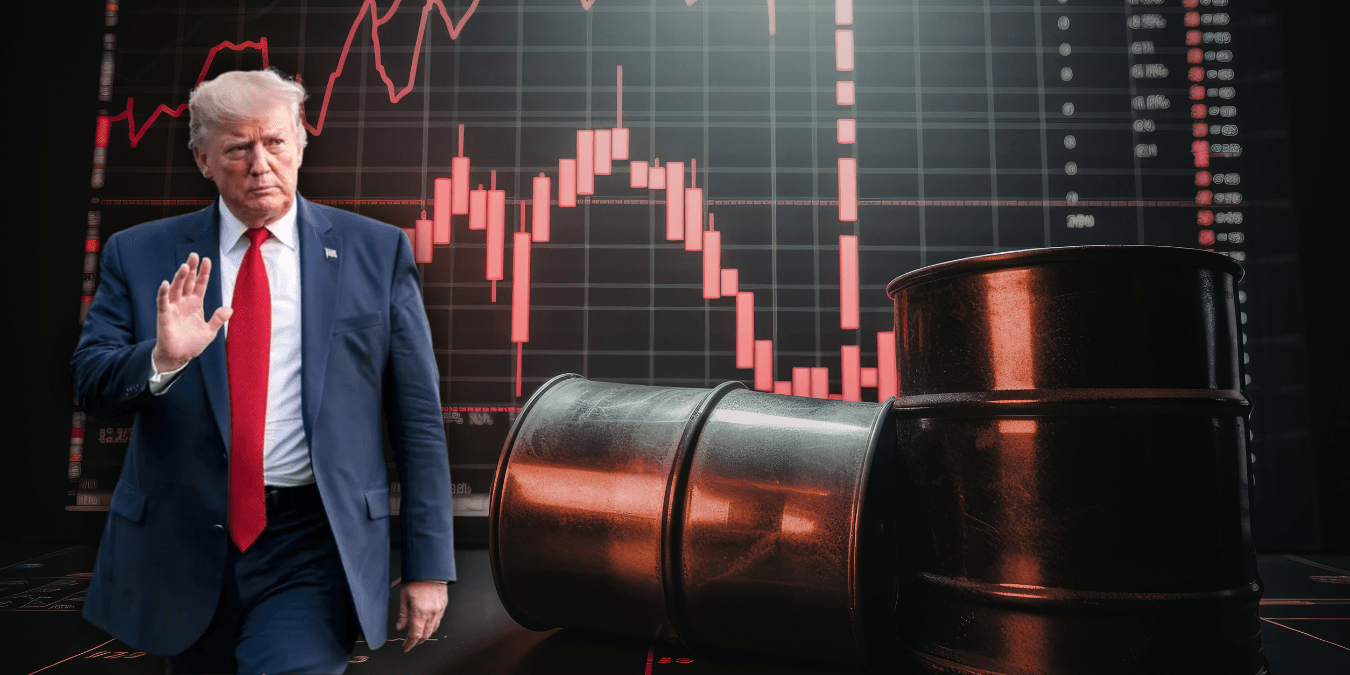
3. U.S. Strategic Petroleum Reserve (SPR) Release. President Trump has so far declined to release oil from the SPR, calling current prices “a very small price to pay” for national security. A reversal of this decision would be a meaningful short-term boost for markets and consumers. Watch for G7 coordination on strategic reserve releases.
4. Federal Reserve Communication. Any signal from the Fed that it will tolerate higher inflation — or conversely, raise rates to combat it — will drive sharp moves in both bond and equity markets. Watch FOMC statements and Fed Chair commentary closely.