There’s a particular kind of silence that falls over trading floors when the market is bleeding. Terminals flash red. Volume surges. Portfolio managers stare at screens with the practiced calm of surgeons who know the patient is in trouble but refuse to show it. That was Wall Street in early April 2025, when the S&P 500 slid into a swift, punishing 10% drawdown that rattled retail investors, triggered margin calls, and sent financial media into full crisis mode.
And then, just as quickly as it started, it stopped.
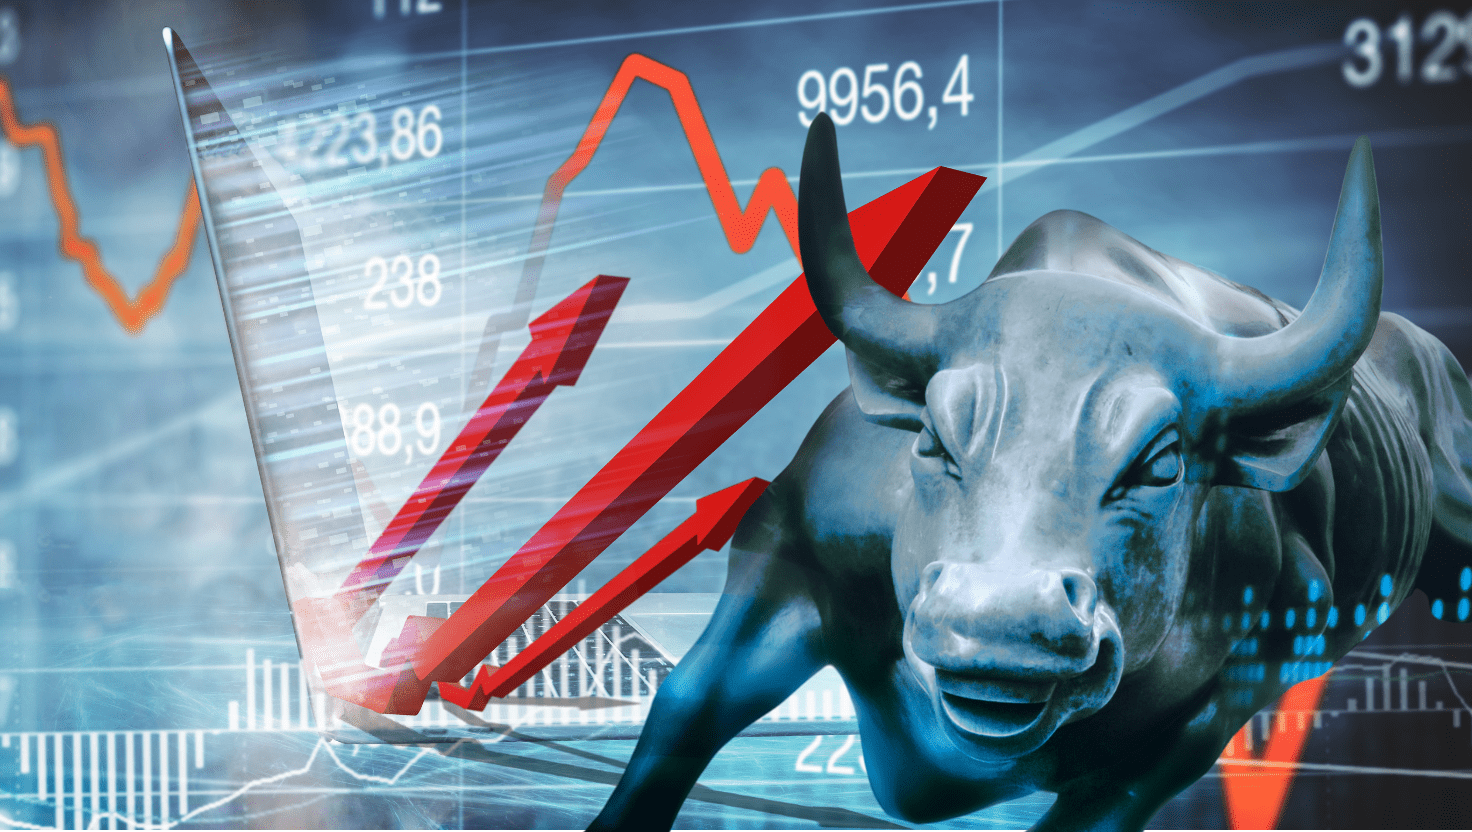
In 11 trading sessions, the market didn’t just stabilize. It roared back. It clawed, climbed, and ultimately erased the entire drawdown in one of the most compressed V-shaped recoveries seen in recent memory. For investors who held their nerve, it was vindicating. For those who panic-sold near the bottom, it was a brutal lesson in market psychology. For analysts and strategists, it raised a question worth unpacking carefully: Was this recovery predictable, or did Wall Street genuinely catch everyone off guard?
The honest answer is both, and understanding why requires looking at the mechanics underneath the move.
What Triggered the Drawdown
Context matters here. The selloff didn’t materialize out of thin air. It was the product of converging pressures that had been building beneath the surface for weeks. Tariff escalation fears, particularly around sweeping new trade measures announced in early April 2025, sent shockwaves through equity markets. The concern wasn’t just about the immediate economic impact. It was about uncertainty — the kind of deep, structural uncertainty that makes institutional investors reduce risk exposure across the board.
When large funds de-risk simultaneously, the selling feeds on itself. Passive index funds amplify moves in both directions. Leveraged ETFs rebalance daily, adding mechanical pressure. Retail investors, many of whom had entered the market during the post-pandemic bull run, suddenly faced their first real test of conviction. The 10% drop unfolded with a speed and ferocity that felt disproportionate to the underlying fundamentals — a classic sign that positioning, not just sentiment, was driving the move.
By the time the S&P 500 hit its intraday lows, the CBOE Volatility Index (VIX) had spiked sharply, credit spreads had widened, and the financial press was publishing the kind of headlines that historically mark sentiment extremes. Fear was running the show.
The Anatomy of an 11-Session Reversal
What happened next is where it gets genuinely instructive.
The recovery didn’t begin with a single catalyst. It began with an absence — an absence of additional bad news. Markets had priced in a worst-case scenario on tariffs, and when the follow-through didn’t materialize at the scale feared, a relief rally ignited. This is a dynamic that experienced traders recognize immediately. When a market falls hard on fear of what might happen, any signal that the worst case is off the table creates a violent snap-back in the opposite direction.
That snap-back was then accelerated by several compounding forces.
First, short covering. Traders who had sold short into the drawdown were suddenly staring at losses as prices reversed. Short covering is mechanical and urgent — it adds buying pressure independent of any fundamental conviction about the market’s direction.
Second, systematic re-entry. Quantitative and trend-following funds, which had reduced equity exposure on the way down, began rebuilding positions as momentum signals flipped positive. These funds manage hundreds of billions of dollars. When they rotate back into equities, the buying is substantial and persistent.
Third, retail investor resilience. Contrary to what many assumed, a significant portion of retail investors did not sell during the drawdown. Brokerage data from platforms like Fidelity and Charles Schwab showed net buying activity from individual investors near the lows. This “buy the dip” mentality, cultivated through years of experiencing fast recoveries, acted as a psychological floor under the market.
Fourth, and perhaps most critically, the Federal Reserve backdrop remained supportive enough to prevent a deeper crisis narrative from taking hold. With rate cut expectations still embedded in the market’s longer-term pricing, the bond market didn’t signal the kind of systemic credit stress that turns a 10% correction into a 20% or 30% bear market.
All four forces compounded across those 11 sessions, producing a recovery that looked, on a chart, almost mathematically perfect.
Why Nobody Saw It Coming (And Why That’s Not Surprising)
Here’s where intellectual honesty is important.
When people say “nobody saw it coming,” they’re usually describing something more specific: nobody acted on it with conviction. There were analysts who flagged oversold conditions. There were technical strategists pointing to key support levels. There were sentiment indicators screaming that fear had reached contrarian-buy territory. The signals were there, scattered across research notes and market commentary.
But calling a bottom in real time is one of the hardest things in finance, not because the tools don’t exist, but because the psychological cost of being wrong is so asymmetric. A portfolio manager who calls the bottom correctly is briefly celebrated. One who calls it early and gets steamrolled by additional selling is remembered as reckless. The institutional incentive is almost always to wait for confirmation rather than act on prediction.
This is why V-shaped recoveries routinely “surprise” markets — not because they’re fundamentally unpredictable, but because the decision-making infrastructure of professional investing is designed to confirm trends rather than anticipate reversals. By the time confirmation arrives, a significant portion of the recovery has already happened.
For retail investors watching from the sidelines after panic-selling, this asymmetry is particularly painful.
What History Actually Tells Us About V-Shaped Recoveries
This was not Wall Street’s first rodeo with fast reversals. Looking at market history through an American investing lens, V-shaped recoveries have been a recurring feature of bull market corrections — particularly when the underlying economy isn’t in recession.
The March 2020 COVID crash and subsequent recovery is the most dramatic modern example. From peak drawdown to full recovery took roughly five months, which at the time felt extraordinarily fast given the scale of the economic disruption. The December 2018 selloff, which saw the S&P 500 fall nearly 20% in the fourth quarter before recovering fully by April 2019, followed a similar pattern. The August 2015 “flash crash” correction resolved itself within weeks.
The pattern that emerges across these episodes is consistent: when the Federal Reserve is not actively tightening into a downturn, when corporate earnings remain intact, and when credit markets stay functional, corrections tend to resolve quickly. The economy provides a fundamental floor, and the liquidity of U.S. equity markets ensures that when sentiment shifts, it shifts fast.
What made the April 2025 recovery notable was its speed relative to the size of the drawdown. An 11-session full reversal of a 10% decline is genuinely compressed even by historical standards. It speaks to a market that has become structurally more responsive — thanks to algorithmic trading, passive fund rebalancing, and the speed of information dissemination — but also more prone to overshooting in both directions.
The Behavioral Economics Behind the Surprise
There’s a rich vein of behavioral finance literature that helps explain why these recoveries feel surprising even when they’re historically consistent. Nobel laureate Daniel Kahneman’s research on loss aversion remains foundational here. Humans feel the pain of losses roughly twice as intensely as the pleasure of equivalent gains. During a 10% drawdown, the psychological experience is not just discomfort — it’s a kind of financial grief that crowds out rational probabilistic thinking.
When markets start recovering, loss-averse investors don’t immediately experience relief. They experience suspicion. Is this a dead cat bounce? Will it roll over again? This caution means that retail investors often don’t re-enter the market until the recovery is well advanced, missing a substantial portion of the gains.
There’s also the role of narrative. During a sharp drawdown, financial media naturally produces a continuous stream of bearish content because bearish content is what the audience demands during fearful moments. This narrative momentum lags the market itself. By the time the recovery is clearly underway, the dominant media narrative is still focused on the risks that drove the selloff. This cognitive dissonance — the market going up while the news sounds terrible — is precisely the environment in which fast recoveries are hardest for individual investors to act on.
What Professional Investors Did Differently
The investors who navigated this recovery well weren’t necessarily smarter. They were better prepared at the process level.
Institutional portfolio managers who maintained their strategic equity allocations through the drawdown — rebalancing mechanically when equity weights fell below targets — participated fully in the recovery. This sounds simple. In practice, when your equity portfolio is down 10% and every headline is screaming about tariff wars and economic slowdown, maintaining allocation discipline requires genuine institutional fortitude.
Some of the most sophisticated hedge funds used the volatility to do something counterintuitive: they bought options protection during the rally that preceded the drawdown, which meant they were hedged going into the selloff and could add to equity positions opportunistically near the lows without fear of catastrophic downside. This is a strategy that requires both foresight and discipline — not the kind of reactive decision-making that characterizes most market participants.
The broader lesson from professional investing practice is that market volatility is a resource to be managed, not just a risk to be feared. The 11-session recovery created significant alpha for investors who had the positioning and psychological framework to take advantage of it.
What This Means for the American Investor in 2026
Standing in April 2026, a year removed from that sharp episode, the recovery has fully embedded itself into the market’s price history. The S&P 500 has continued its longer-term advance. For investors who lived through the drawdown and held, the experience validated a long-term orientation. For those who sold, the episode reinforced — painfully — why market timing is statistically one of the least reliable strategies available to individual investors.
The DALBAR Annual Quantitative Analysis of Investor Behavior has documented for decades that the average equity investor consistently underperforms the index they’re invested in, primarily because of poorly timed entries and exits around exactly the kind of volatility events described here. The gap between what the market returned and what the average investor captured is not a small rounding error. It is the single largest drag on American household wealth-building through equities.
There are practical takeaways from the April 2025 episode that remain directly applicable.
First, having a written investment policy statement before volatility strikes changes how investors behave during volatility. When the plan is documented and pre-committed, the psychological barrier to panic-selling is meaningfully higher.
Second, understanding the difference between a correction and the beginning of a bear market requires looking at economic fundamentals, credit markets, and earnings trends — not price action alone. In April 2025, the fundamentals did not support a prolonged bear market thesis, even when the headlines did.
Third, the speed of modern market recoveries has shortened the window in which investors can act on emotional impulses and still repair the damage. When recoveries take months, a late re-entry still captures most of the gain. When they take 11 sessions, the math is unforgiving.
The Structural Question Wall Street Is Still Asking
Beyond the immediate episode, the April 2025 recovery raised a structural question that market participants and regulators are still working through: Has the combination of passive investing, algorithmic trading, and 24/7 information flow made markets structurally more volatile in the short term while remaining fundamentally sound over longer horizons?
The evidence suggests yes. Markets today move faster in both directions than they did twenty years ago. Circuit breakers, implemented after the 1987 crash and refined through subsequent episodes, provide some brake on the most extreme intraday moves. But the velocity of modern market dislocations — and recoveries — is something that financial education, particularly in the retail investing community, has struggled to keep pace with.
BlackRock, Vanguard, and other major asset managers have increasingly emphasized behavioral coaching alongside investment products, recognizing that the primary risk for most American investors isn’t market risk in the abstract. It’s the behavioral risk of reacting to short-term volatility in ways that permanently impair long-term returns.
The V-shaped recovery of April 2025 was, in this sense, not just a market event. It was a stress test of investor behavior at scale. The results were mixed, as they always are. Some passed. Many didn’t.
The Takeaway That Matters Most
Markets are not rational in the short term. They are the aggregate expression of human fear, hope, greed, and uncertainty processed through the mechanism of price. The 10% drawdown in April 2025 was real. The fear that accompanied it was real. And the 11-session recovery that erased it was also real — even if it felt, in the moment, almost impossible to believe.
The investors who built wealth through this episode weren’t necessarily prescient. They were disciplined. They had a framework that didn’t require them to predict the exact shape of the recovery in order to participate in it. They stayed invested, rebalanced mechanically, and let the structural resilience of the American equity market do what it has historically done: recover.
That’s not a guarantee about the future. No honest financial professional will offer one. But it is a pattern with enough historical consistency that acting against it — selling into fear with no clear criteria for re-entry — has, over long periods, been one of the most reliably expensive decisions an American investor can make.
The V-shaped recovery nobody saw coming was, in a deeper sense, the recovery that always comes for those patient enough to wait for it.
This article is intended for informational and educational purposes only and does not constitute financial advice. Past market performance is not indicative of future results. Consult a qualified financial advisor before making investment decisions.