Wall Street just suffered its most painful sustained weekly decline in nearly four years. The S&P 500 has now logged five consecutive weeks of losses — the longest weekly losing streak since May 2022 — erasing hundreds of billions of dollars in market value and rattling investors from Main Street to institutional trading desks. If your 401(k) or brokerage account looks noticeably lighter than it did a month ago, you are not alone, and the causes are both understandable and serious.
This deep-dive breaks down exactly what triggered the sell-off, how it stacks up against past downturns, which sectors took the worst hits, and — most importantly — what thoughtful investors should do right now.
How Bad Is “Five Weeks of Losses,” Really?
To appreciate the gravity of this streak, context matters. The S&P 500 does not often close lower week after week for an extended period. Since 1950, multi-week losing streaks of five or more weeks have occurred only a handful of times per decade — typically clustering around recessions, geopolitical shocks, or major policy turning points.
The last comparable streak came in May 2022, when the index sold off aggressively as the Federal Reserve launched its most aggressive rate-hiking cycle in four decades. Before that, investors had to look back to the early COVID-19 crash in March 2020 for a comparable streak, though that one was far more violent in magnitude.
The current five-week streak has pushed the S&P 500 approximately 8.7% below its January 2026 all-time high. The Dow Jones Industrial Average has fallen into correction territory (defined as a drop of 10% or more from a recent peak), and the Nasdaq — home to the growth and technology stocks that powered the 2023–2025 bull market — has also sunk into correction. In raw terms, the “Magnificent Seven” mega-cap tech names alone collectively shed more than $330 billion in a single day during the streak’s worst session.
This is not a routine, healthy pullback. It is a regime shift, and it deserves a thorough explanation.
The Convergence of Forces Driving the Sell-Off
No single event caused five straight weeks of losses. Instead, a constellation of overlapping pressures hit markets simultaneously, each reinforcing the others. Here is a structured breakdown of the primary drivers.
The U.S.–Iran Conflict and the Oil Price Shock
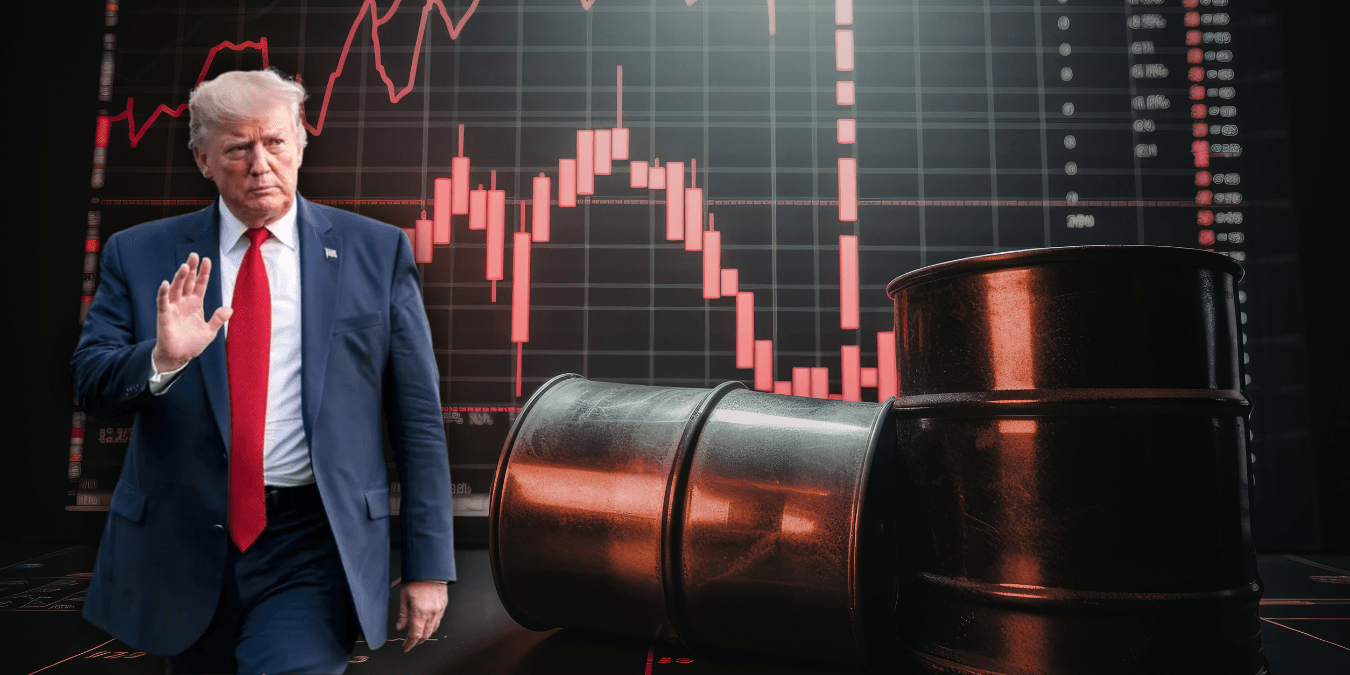
The most immediate catalyst was a dramatic escalation in geopolitical tension between the United States and Iran. As hostilities intensified, global oil markets reacted swiftly. Brent crude surged past $106 per barrel, and West Texas Intermediate crossed $100 — levels not seen in several years. Fears that the Strait of Hormuz, through which approximately 20% of the world’s traded oil passes, could face sustained disruption sent energy prices spiking.
For equity markets, higher oil prices are a double-edged problem. They raise input costs for businesses across virtually every industry — transportation, manufacturing, retail, agriculture — and they simultaneously stoke consumer price inflation, putting additional pressure on already-strained household budgets. The stock market’s worst individual week of the five-week streak coincided directly with the sharpest oil spike.
A Hawkish Federal Reserve Refusing to Blink
Entering 2026, many market participants had priced in two or three Federal Reserve interest rate cuts during the year, based on expectations that inflation would continue cooling toward the Fed’s 2% target. Those hopes have been systematically dismantled.
The Fed, under continued pressure from above-target inflation readings, has signaled that rate relief may be limited to just one cut in 2026 — and even that is contingent on a meaningful deceleration in price pressures. The 10-year Treasury yield has moved firmly above 4%, compressing the valuation multiples of growth stocks (particularly technology) that had been priced on expectations of lower discount rates. When the risk-free rate rises, the present value of future earnings falls — and that math has been punishing for the Nasdaq in particular.
Persistent, Sticky Inflation
Each monthly Consumer Price Index (CPI) and Producer Price Index (PPI) release in early 2026 has come in above consensus forecasts, reinforcing the narrative that the disinflation trend of 2024–2025 has stalled. Services inflation — particularly in healthcare, housing, and insurance — has proven especially resistant to the Fed’s tightening measures. When investors realize inflation is not cooperating, they reprice rate expectations higher, bonds sell off, yields rise, and equities follow.
Tariffs and Trade Uncertainty
President Trump’s tariff agenda has added another layer of cost pressure and uncertainty for U.S. corporations. Sectors with significant international supply chain exposure — semiconductors, consumer electronics, automotive — have had to grapple with the prospect of higher input costs, potential retaliatory measures from trading partners, and reduced global demand. Corporate earnings guidance has grown increasingly cautious as management teams struggle to forecast their cost structures in a fluid trade policy environment.
Algorithmic Feedback Loops and Forced Selling
Beyond the fundamental drivers, market structure has amplified the declines. Systematic and quantitative strategies — which now account for a substantial share of daily trading volume — are programmed to reduce equity exposure when volatility exceeds defined thresholds. As the VIX (the market’s “fear gauge”) spiked, these strategies sold equities mechanically, deepening intraday drawdowns and turning what might have been a moderate correction into a sustained, grinding weekly losing streak.
- Agentic AI Is Coming for Your Job in 2026 — But Not in the Way You Think

- Bitcoin Above $76,000 and Climbing: Is Crypto Quietly Becoming the Safest Bet in a War-Rattled U.S. Market?

- Bitcoin Could Hit $250,000 or Drop to $50,000 — What Top U.S. Firms Like Grayscale and Galaxy Digital Are Predicting
- From Spam Filters to AI Doctors: How 55% of Americans Are Already Using AI Without Realizing It

- From Wall Street to Main Street: How Big U.S. Financial Institutions Are Flooding Into Crypto in 2026

- From Wall Street to Your Wallet: The Real Impact of the Dow’s Correction on Everyday Americans

Sector-by-Sector Breakdown: Winners and Losers
The five-week sell-off has not been uniform across the market. Understanding who got hurt — and who held up — reveals important information about where money has been flowing.
Technology and Growth: The Hardest Hit
The Magnificent Seven — Apple, Microsoft, Alphabet, Amazon, Nvidia, Meta, and Tesla — were the epicenter of the pain. These stocks had driven an outsized portion of the S&P 500’s gains in 2023–2025, meaning their elevated valuations left them most exposed to rising yields and deteriorating risk appetite. Nvidia and Tesla both suffered double-digit percentage losses during the streak. Meta and Alphabet, while more fundamentally resilient, were not spared from the broader technology sell-off.
Energy: The Standout Bright Spot
In stark contrast, the energy sector posted gains as oil surged. Exploration and production companies, pipeline operators, and oil-field services firms all benefited from higher crude prices. This created a significant divergence: while the S&P 500 fell, energy ETFs and large-cap oil names like ExxonMobil and Chevron quietly outperformed the market for the fifth straight week.
Financials: Mixed Results
Bank stocks faced a complicated picture. Higher long-term yields can improve net interest margins (a positive for lending profitability), but a weaker economic growth outlook raises concerns about loan defaults and credit quality. Regional banks in particular underperformed as investors worried about commercial real estate exposure and tightening credit conditions.
Defensive Sectors: Relative Safe Havens
Consumer staples, utilities, and healthcare — the classic “defensive” sectors — held up better than the broader market. Companies like Procter & Gamble, Johnson & Johnson, and Duke Energy saw relatively modest declines, as their predictable cash flows and dividend yields attracted risk-averse capital. In a market where risk-off sentiment dominates, defensives rarely rally, but they do tend to fall less.
Small Caps: Double Trouble
The Russell 2000 Index of small-cap stocks was hit hard for a different reason. Small companies tend to carry floating-rate debt, meaning higher interest rates directly squeeze their earnings. Combined with concerns about a slowing economy, smaller domestic companies underperformed large-caps throughout the streak.
Historical Playbook: What Happens After Five-Week Losing Streaks?
History doesn’t repeat itself exactly, but for investors searching for precedent, the data offers some measured reassurance.
A historical analysis of five-week losing streaks going back to 1980 found that the S&P 500 has averaged a gain of just 0.03% in the immediate week following such streaks — barely positive, suggesting the market doesn’t snap back instantly. However, the five-week window after those streaks produced an average gain of 2.15%, compared to just 0.68% for all five-week periods — a meaningful statistical edge for patient investors.
More qualitatively, the 2022 analogue is instructive. After the S&P 500’s five-week losing streak that spring, markets bounced sharply in the summer of 2022 before ultimately making new lows in October 2022 — a classic “bear market rally” pattern. The difference today is that corporate earnings remain considerably healthier than they were during the 2022 trough, suggesting the fundamental floor may be higher this time.
The COVID-19 March 2020 analogue is even more striking: the five-week crash was followed by one of the fastest recoveries in market history, aided by massive fiscal and monetary stimulus. That kind of policy response is less available today, given the Fed’s inflation-fighting mandate.
What Comes Next: A Scenario Framework
No analyst can predict markets with certainty, but framing the range of plausible outcomes helps investors make informed decisions.
Scenario 1 — Geopolitical De-Escalation (30% probability): A diplomatic breakthrough or a reduction in U.S.–Iran hostilities would likely send oil prices retreating sharply, ease inflation expectations, and give the Fed room to signal a more accommodative path. In this scenario, the S&P 500 could recover 4%–6% over the subsequent three months, led by a rebound in technology and consumer discretionary.
Scenario 2 — Stagflation-Lite / Muddle-Through (40% probability): Oil remains elevated, GDP growth moderates to 1%–1.5%, and the Fed holds rates steady. The market grinds sideways to modestly lower for several months before finding a base. This is the “most likely” scenario given current data, and it argues for patience and defensive positioning over aggressive dip-buying.
Scenario 3 — Escalating Conflict / Policy Error (20% probability): A wider regional conflict or a Fed misstep (tightening into weakness) pushes the S&P 500 into a deeper correction of 15%–20% from peak levels. This scenario would likely involve a test of the 200-day moving average and potentially the psychologically significant 5,000 level.
Scenario 4 — Earnings-Led Recovery (10% probability): Q1 2026 corporate earnings (reported in April and May) come in meaningfully ahead of already-lowered expectations, restoring confidence and triggering a rotation back into growth. Technology leads a recovery as the market reprices earnings resilience over macro fear.
What Should Investors Do Right Now?
Don’t Panic — But Don’t Be Complacent
Five straight weeks of losses feel catastrophic, especially when portfolio statements arrive. But the S&P 500 remains above its 2024 levels. Long-term investors who maintain diversified, balanced portfolios have experienced setbacks like this before — and have historically been rewarded for holding steady.
Dollar-Cost Average Into Weakness
For investors with regular contributions — such as those making 401(k) deferrals each paycheck — this is exactly the mechanism working in their favor. Buying shares at lower prices during a downturn reduces the average cost basis and amplifies long-term returns when the market eventually recovers. Resist the urge to pause or reduce contributions during a sell-off.
Review, Rebalance, Don’t Abandon
If recent gains in technology had pushed your portfolio to an uncomfortably high growth-stock concentration, this drawdown may have naturally rebalanced your allocation. Review your asset mix relative to your stated risk tolerance, and consider whether a modest tactical tilt toward value, energy, or dividend-paying stocks makes sense for the near term.
Monitor These Five Macro Indicators
The following data points will most directly influence whether this sell-off deepens or stabilizes:
- Monthly CPI and PPI releases (watch for any deceleration in services inflation)
- Federal Reserve communications (speeches, FOMC minutes, and the June meeting dot plot)
- Oil inventories and geopolitical developments (weekly EIA reports, Strait of Hormuz shipping data)
- Q1 2026 earnings guidance (particularly from mega-cap tech and consumer-facing companies)
- U.S. labor market data (any material softening in jobs would accelerate rate-cut expectations)
Consider Hedging Strategies If Appropriate
For sophisticated investors or those with concentrated equity positions, options strategies such as protective puts or collar strategies can limit downside exposure during periods of elevated volatility. The VIX’s current elevated levels mean options premiums are higher than usual, so cost-benefit analysis is essential before layering on hedges.
The Bigger Picture: Is This the Start of a Bear Market?
A bear market is technically defined as a 20% or greater decline from a recent peak. At roughly 8.7% below its all-time high, the S&P 500 is in correction territory but not yet a bear market. The distinction matters because corrections are common (they occur roughly once a year on average) and are almost always followed by recovery to new highs within 12–18 months.
Bear markets are far less common and typically require a fundamental catalyst — a recession, a financial system crisis, or a severe and sustained earnings collapse. None of those conditions are clearly present today. U.S. GDP growth, while moderating, remains positive. Corporate balance sheets are generally strong. Credit markets are stressed but not broken. The U.S. banking system does not appear to face the systemic risks seen in 2008 or 2023.
That said, the probability of a recession has risen as oil prices bite into consumer spending and business investment. If GDP growth falls below 1% for two consecutive quarters, the narrative will shift — and markets will re-price accordingly. This is the key threshold to watch.
The Bottom Line
The S&P 500’s five-week losing streak is the most prolonged weekly decline since 2022, driven by a potent convergence of geopolitical shock (the U.S.–Iran conflict), surging oil prices, entrenched inflation, a hawkish Federal Reserve, tariff uncertainty, and mechanical selling by systematic strategies. The pain has been real, with the Dow in correction territory and the Nasdaq not far behind.
Yet historical data offers guarded optimism: multi-week losing streaks have often been followed by meaningful medium-term recoveries, particularly when underlying economic conditions remain stable. The path forward will depend heavily on whether geopolitical tensions ease, whether inflation convincingly decelerates, and whether corporate America delivers earnings that justify current valuations.
For most long-term investors, the correct response is disciplined — not panicked. Stay diversified, continue systematic investing, monitor the macro indicators outlined above, and resist the emotional impulse to abandon a well-constructed long-term strategy because of five difficult weeks. Markets have weathered far worse, and they have consistently rewarded those who stayed the course.
This article is intended for informational and educational purposes only and does not constitute personalized investment advice. Past market performance is not indicative of future results. Consult a licensed financial advisor before making investment decisions.